XP Padding

Did you know that Liz and I have a total of 23 years of finance experience?  That’s pretty amazing to think about.  A family unit has over half an entire career lifetime’s worth of knowledge in an industry?  Wow!

That means, collectively, we know as much about the credit/deposit industry as someone who’s worked in it since the 1990s.  And to think that in 1998, we were in middle school.

Yes, I’m being obnoxiously sarcastic here, because this crap needs to stop.

It’s encountered more among younger managers with lower payband teams.  Some smoothskin fresh out of business school wants to make a large group of grunts feel important, so they come up with ways to make menial work sound valued with big numbers.  Now, pulling from my own career experience, a 1000 people with 1-2 years tenure in a call center have, according to this asinine logic, 1-2 thousand years experience with the company!  Big numbers are exciting and I feel like I’m actually contributing significantly to the bottom line!

No, I don’t.  I felt patronized.

I will explain why this is stupid.

Given that entry level employees share the same basic knowledge pool from their training, this knowledge overlaps.  It doesn’t compound.

Given that knowledge is dependent on the individual’s memory to be of use.

Given that memories fade after their creation.

Then a large pool of shared knowledge only increases the chance that a selection of said knowledge is retained somewhere in the group, but still fails on the individual level at the same rate.

Therefore increasing the labor pool only increases the chance that someone retains an element of training, not that the collective unit as a whole can all access this information simply because one person has it.

Therefore experience is not cumulative across a group.  It can only complement the total group’s value.  It’s part of the equation, certainly, but a different formula is needed beyond Excel 101 sum(A:A).  Something more complicated is required.

***

I will begin with Hermann Ebbinghaus’s oft-referenced simplified formula on memory loss.  Where t is time and S is the relative strength of a memory, then R equals the probability of that memory being recalled:

R = exp(-t/S)

For the sake of this exercise, I will assign t to the number of days since the memory was created, and S to a static value of 25–which I’m arbitrarily defining as a 25% value to the individual, because work training material is really riveting.

In this example, a person trying to recall a fact after 7 days would have a 76% chance of doing so.

Now if we scale this to a group, cumulative probability would calculate the chance at which all people with a group, P, would recall that memory (Rc):

Rc = (exp(-t/S))^P

Let’s say 3 people are in this group.  Scaling the above example would yield a 43% chance of every person remembering the fact.  The more people we add to the group, the less the chance that all members would remember the same fact.

I’m going to get crazy here and use this as a basis for my own theorem: Simon’s Theorem on Group Memory Loss Dynamic Experience Offset over Time.

And theorem’s are great, because they’re hypothetical formula extrapolated as mathematical representations of empirical observations.  As long as the math itself is correct, no one can deny what I’ve witnessed personally.  Ergo, while I can never prove my theorem to be right, no one can prove it’s wrong.  Suck it!

Ahem.  Anyway…

I’ll assign a value to the group now (Ev).  As in usefulness, not numerical.  A 1:1 would be the ideal ratio, but that’s not going to happen because of the initial premise.

Ev = P((exp(-t/S))^P)

So after 7 days, the data retention of those 3 people on a 25%-level of interest piece of information turns these people’s usefulness, as units of the whole, into the equivalent of 1.3 people.  Note how increasing the personnel further reduces the usefulness.  That’s because, again, information isn’t pooled across the group.

But also remember that increasing the group size increases the probability that any one individual will remember the information (Rg).  So we take the individual retention rate and raise it to the inverse of the group size.  Retention will never be perfect.  A data point may be lost to time no matter how many people are hired.  But it does continually raise the probability:

Rg = exp(-t/S)^(1/P)

Of those 3 people, individually there’s only a 76% chance that a specific individual will remember a piece of information, and of the group there’s only a 43% chance that they will all retain that information, but across the group there’s a 91% chance that any of them will remember that information.

This is where the group size makes an impact–on the chance that across the group as a whole, one of them will prove their use having retained the necessary information.  By increasing the group size, we increase that possibility.

But let’s go even further.  Because if you’re still reading, I feel we’re now on a journey together and I don’t want to disappoint.  I’ve grown fond of you, dear internet reader.

And because, if you’re very attentive, you’ll note that time will still gnaw away at the group recollection chance.  More people will increase the chance, but that’s not scalable.  What we need is a third way to increase value, since we can’t ever reduce time, and staff size always has a limit.  We need another variable.

That’s right!  We increase the number of informational items, which we have to do over time, else memory loss will still degrade the total usefulness at the same rate.  So we increase the total number of informational points learned per day.

I offer one final formula: the ultimate value of the group (Uv), which incorporates the logic of the prior formulas, quantifies the equivalent value of the group based on the equivalent value of people as units, but taking into account the chance of any one person remembering a select piece of information, and increases the value based on the number of information points presented per day (I) for the duration of t:

Uv = exp(-t/S)P((exp(-t/S))^P)tI

As mentioned, this value degrades with time, but can be increased with additional information points.  Also known as experience.  Ah, we’ve come full circle finally.

Conclusion:

The value of a group is more complicated than its collective time.  If we base the value on total information, we can’t assume that all members of a group retain that information, and a linear function doesn’t apply.  We can increase the value of the group by increasing its number, which in turn will increase the chance that information will be retained by an individual, but to ultimately avoid group value loss, additional information–or novel experience–must find its way into each individual of a group on a continual basis.

And this is why we can’t just add up everyone’s tenure.  Experience isn’t cumulative.  It’s one variable in a probability function that someone in a sample size will increase group value through novel experience recollection.

Maybe lower management should cut back on the 3 martini lunch team building.

–Simon


  • t = # days
  • S = strength of memory (25%)
  • P = total # of people trying to remember
  • I = items of value learned per t
  • R = probability of memory retention
  • Rc = Chance of all people remembering
  • Ev = Equivalent value of total people as units
  • Rg = Chance of any one person remembering from total # of people
  • Uv = Ultimate value of group

Kópsimodendroacrophobia

The fear of cutting wood at heights

Also: Phobia Quotient!

The neighbors rented a boom.

(A tangent here–I don’t think I’ve ever created a name for these neighbors, probably because they’re nice and reasonably normal.  I’ve just called them by their first names: Brian and Kelly.  Let’s change that now.  I shall call them the Busybees.  Because they’re always rather busy.)

Anyway, they hate trees.  Well, to be fair, all Ohioans hate trees.  Almost as much as they hate dressing appropriately for the weather.  Liz is a prime example.  She also hates trees.  Here’s a typical conversation:

Statement: “This tree looks a little brown.”

Response: “Cut it down!”

Statement: “This branch looks dead.”

Response: “Cut it down!”

Statement: “This tree isn’t perfectly erect.”

Response: “‘Erect’…*teehee….Cut it down!”

But this year the trees in question really did look dead, and so I agreed after much insistence to cut them down.  Liz, the Ohioan, had already been convinced.

Cut it down!

So after this roundabout lengthy preamble, I arrive at the point of my post: I don’t like heights.  Never did.  Figured those who do are idiots or showoffs.  Of course, in my youthful egocentric stubbornness, I forced myself to endure them.  Indoor rock climbing, rappelling, mountain hiking, amusement parks–been there; done that.  And while being young grants a greater allowance for risk in the face of death, probably due to the amount of testosterone that was oozing out of my every orifice, approaching middle age has forced a more practical approach to death–like fearing things that cause it.

Consequently, my parasympathetic nervous system now strongly advises me that death should be avoided and doing certain things increases its risk potential.

But damned if I didn’t try.  I went up there twice and cut branches, though in the end, Liz did the bulk of the work.

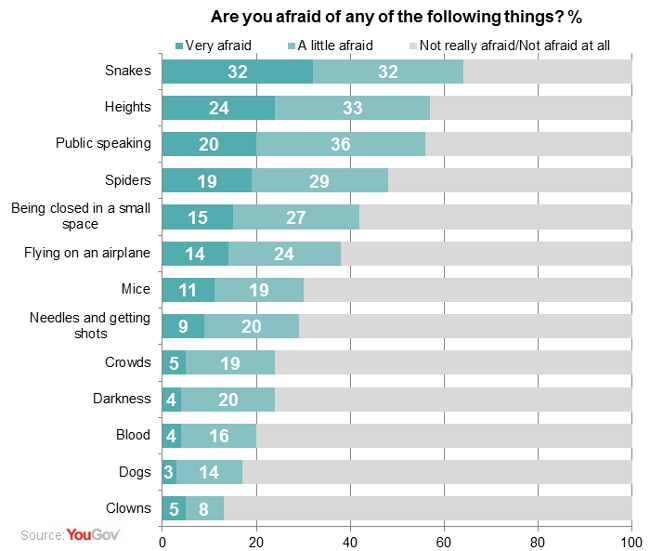
So this got me thinking.  Is my phobia truly debilitating, or just a common healthy fear of death, albeit somewhat too strong?  Internet time!

I didn’t vet this information at all, but it seems sound.  Let’s see how I stack up:

  1. Snakes?  Some Indiana Jones shit right there.  But they do have a creepy shape and are among the few large terrestrial animals that are venomous, so I get it.  I do not have this fear.  Pass.
  2. Heights.  Already discussed.  Good to know this is #2.  Fail.
  3. Public Speaking.  I don’t really think this is a phobia.  It’s anxiety over social acceptance, not a life or death scenario, unless you consider the tribal fear of being banished which might lead to death.  Exempted.
  4. Spiders.  See #2, though they’re smaller.  I like spiders.  Pass.
  5. Claustrophobia.  I don’t like being restrained, probably from childhood memories.  My parents thought it was funny to sit on me for extended lengths of time.  Sick Boomer humor.  But small places don’t bother me.  Pass.
  6. Airplanes.  Nah.  I hate them more than fear them.  Smell farts for hours, get felt up by security, then packed in like an Amazon warehouse.  But not fear.  Pass.
  7. Mice?  No.  Pass.
  8. Needles.  I hate getting poked.  Triggers a primal fear, though I don’t have a panic attack from it.  Pass.
  9. Crowds.  Nah.  Just an inconvenience.  Pass.
  10. Darkness?  Only after watching Alien or Jurassic ParkPass.
  11. Blood?  Only my own.  Pass.
  12. Dogs.  I love dogs.  Pass.
  13. Clowns?  I hate them, but it’s not fear.  Sort of like cats.  Shoot them for entertainment, but that’s it.  Pass.

My total score: 1/12.  But, these are weighted based on commonality, so I will use sketchy math to quantify this.

I’ll take the inverse of each item (only counting the “very afraid” numbers, because really, most of us are probably “a little afraid” of many of these, which does not a phobia make), multiplying by 100, and excluding #3, the total equals 169.9.  This is the total max sissy quotient, which I’ll set as the baseline of 100% total sissy.

I posses #2, inverse of which is 4.2.  Then to scale it with the baseline, that’ll be 4.2*100/169.9, which equals 2.5%.  I am a 2.5% sissy.

But where is the median sissy?  I really don’t know, because I don’t see these as cumulative probability, so let’s take a nice midpoint in the range: 5+((32-5)/2)=18.5.  1/18.5*100=5.4.  5.4*100/169.9=3.2% sissy.  So I’m lower than baseline, according to my questionable math from unvetted sources.

I guess I’m pretty normal after all.

But you’re a total sissy if you fear blood.

–Simon

Blue Collar Cost

It’s been a while since I added an entry to the Quantitative Philosophy section.  And in light of the recent glass door replacement debacle, as well as my growing experience with home-ownership in general, I have enough information now to present a new calculator: The Blue Collar Cost Estimator!

What is this calculator?  Well, ever notice how what would seem like an affordable project immediately becomes cost-prohibitive when requiring hired help?  So here’s how it works: for any home renovation/repair, input what you think would be the conservative estimate for the raw materials.  The calculator will then add the contractor’s up-charge and account for the cost of labor (which is substantial).  Here’s the formula:

Estimated Materials Cost * 1.45 * 4 = Final Cost

Here’s the logic.  The 1.45x multiplier seems, at least anecdotally, to be the materials’ up-charge.  The 4x multiplier seems to be the labor charge, which inexplicably scales directly with the initial cost of the materials.  I guess they figure the risk of damage warrants greater skill/care?  Dunno.

But that’s it.  Nice and simple.  For calibration, I tested two expenses.  The latest was the door replacement, which I estimated would have a materials cost of $1000.   1000*1.45*4=$5800, the exact amount of the final cost.  We also had a garage door spring replaced, which I estimated at $120.  120*1.45*4=$696, which is pretty close to the $700-ish final cost we paid.

There you have it: the scaling cost of blue collar labor.  Glad I figured out how to install laminate flooring.  The last room I did would have cost us almost $2500.  So try to be handy–your wallet depends on it.

–Simon

Football Conversations

As a non-football watcher, I’ve spent many a conversation pretending to have watched something I didn’t, or to care about something I don’t, and to use grammatically unsound complex sentences of negation.

At first, I would maintain the charade as football fans, when discussing football, are complete conversational narcissists, and would never notice that I wasn’t adding anything meaningful to the conversation.  These one-sided discussions would invariably crescendo to an emotionally-charged climax, upon which I would just agree with whatever was said last and laugh, which in turn led to some mutual conclusion that escaped me because I don’t watch football.

Now, I just don’t care enough about garnering favor with random people at the coffee station, so I don’t humor the smalltalk anymore, or so was my intent.  Unfortunately, a surprising majority of people take the dismissive comment to be a joke (for what kind of American doesn’t watch football?), and interpret it as encouragement–thus putting me into the conversation anyway.

So I decided that, as it’s been said: If you can’t beat ’em–kill everyone.  Or rather, inwardly sigh sadly and pretend to follow along.  But I need assistance.  I need information…obtained through any other means than reading, watching TV, or conversing with my fell Man.

I needed an aggregator and summarizer.  I needed the absolute bare minimum content required to form a cohesive thought.  I needed the equivalent of a Twitter feed of sports commentary, but without the racism/sexism/homophobia (the entire social aspect, basically).  I needed a means by which to trawl football articles and identify the most-used words, negating general sentence structure such as definite articles and conjunctions.

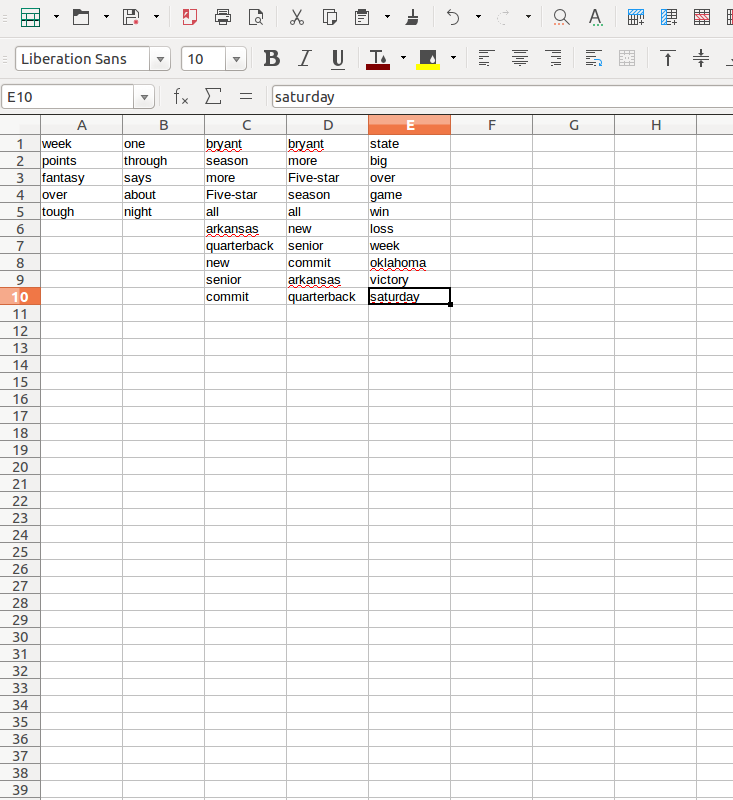
Fortunately I found this site: wordcounter.net.  Probably not its intended use–I began pasting the top football news articles into its form and analyzing their content.  I checked 5 such posts, and compiled their keywords:

The first two articles didn’t have enough meaningful content for a full 10 words

Okay, I could work with this.  This Bryant fellow seems to be a highlight.  I’m sure I could muddle through the rest.

I decided to test my theory on Liz, and texted her the following message:

“I heard that in Bryant’s week one, he scored enough points that it’ll be his big season.  He’ll make a good five-star Fantasy Football pick.  Despite the initial loss, Arkansas will recover with enough victories to stay in the running.”

Liz responded:

“What are you reading?”

She was intrigued!  Had I pulled it off?!  I replied, ambiguously:

“Just the highlights.”

She validated my success by sending me an unrelated photo of a dog that was up for adoption.

…Okay, maybe my method needs a little refinement.  Maybe I can pull a larger sampling of articles and write a formula to analyze the character strings.

Or maybe, just maybe…when I tell you I don’t watch football you could stop talking to me about football and I wouldn’t have to design a logic-based analysis of textual media to formulate responses to your banal and pointless rambling.  Now quit hogging the coffee machine.

–Simon

Query Quotient

Working for a large company, I often find myself in the scenario of needing information.  I therefore seek to resolve this knowledge deficit by sending a simple email to an individual who holds said knowledge.  Yet all too often my queries go ignored.  Why is that?  What deep underlying motivations have possessed this individual to turn a deaf ear to the needs of others?  What cruel, sociopathic inclinations govern this person’s actions?

I debated at length these social dynamics, but the answer wasn’t nearly so disturbing as my overly-dramatic introduction might have implied.  Rather, I conclude there are a few and very simple factors: Does the person feel they have time (an extension of job title and pay grade), does the person feel the inquirer is worthy of their time (also an extension of job title and pay grade), can the person benefit from the inquirer, has the inquirer committed some social slight against them, and does the person like the inquirer?

To distill this even further, from the contactee’s perspective:

  • Are you at my level?
  • Has there or will there be a quid pro quo?
  • Do I like you?

Yet all reasons are not created equal, so based upon entirely subjective reasoning, I have developed a formula to weight them properly:

  1. Each party’s pay grade.  The first thing an email recipient looks at when receiving an email from an unknown party is that person’s job title.  A lot of information can be instantly determined from the hierarchy.  If you’re higher than me, I’d better listen, for my future promotion could depend on it.  If you’re lower than me, well…(dismissive wave of the hand).  If we’re the same level, I should at least consider you a peer, and there’s the possibility that I might work for you one day.
  2. Subjectives.  How well do I know this person, do we work together, do we have a good working relationship, and do I like you?  So much is difficult to determine from an email, but in short, if you’ve pissed me off, then you’re probably not going to get an answer.  Fair?  No.  True?  Always.  From failed experiences, I know to always humble myself accordingly when initiating contact.
  3. Positive Empiricals.  Have you done good work for me before and are you a potential cardinal to my promotion?  Obviously I would want to maintain a relationship with someone who’s benefiting me directly.
  4. Negative Empiricals.  Have you done lousy work for me before and have you beat me out for a job or opportunity?  Obviously I’d want to distance myself from a poor worker, but the last point does seem petty.  However, people take ego blows very seriously, and it’s no coincidence that former colleagues have severed contact when I became competition, and especially if I won.

As for probability, I’ve determined from experience that I will always get a response from a peer if every positive category is satisfied.  I will generally always get a response from someone lower with almost all of these conditions satisfied.  And I will usually get a response from someone higher with every condition satisfied.  However, if any negative conditions are satisfied, then the response rate very quickly drops.  As I stated, it’s weighted, and formerly positive relationships are always easy to sabotage since the human mind tends to remember the bad and not the good.  Here’s the formula for reference:

=IF(Their pay grade>Your pay grade,100*((1/(0.5*(Their pay grade-Your pay grade))/4)+(Do you know them?+Do you work with this person currently?+Is person within your department?+Do you have a positive working relationship?+Do they like you?)/25)+(Have you done good work for them before?+Can you get this person a job/opportunity?)/10)-(Have you done bad work for them before?+Have you beat that person out for job/opportunity?)/5)),IF(Your pay grade>Their pay grade,70+(100*(Do you know them?+Do you work with this person currently?+Is person within your department?+Do you have a positive working relationship?+Do they like you?)/25)+(Have you done good work for them before?+Can you get this person a job/opportunity?)*10)),60+(100*(Do you know them?+Do you work with this person currently?+Is person within your department?+Do you have a positive working relationship?+Do they like you?)/25)+(Have you done good work for them before?+Can you get this person a job/opportunity?)*10)-(Have you done bad work for them before?+Have you beat that person out for job/opportunity?)*10))))

Of course, that nightmarish formula is more readily understood in its natural format: a spreadsheet, so naturally I’ve provided it along with instructions:

https://moorheadfamily.net/data/Query%20Quotient.xlsx

Out of curiosity, I tested it with a recent scenario involving someone from our Legal department.  The calculator suggested a 33% chance of receiving a response, and seeing as it took 3 weeks to get any answer, this figure seems pretty accurate.  Hopefully this tool will allow you to adjust your project timelines accordingly.

–Simon