Years ago, before my employer started its regular “Great Places to Work” program, it maintained a less grandiose practice of occasionally but regularly asking employees for feedback on how it could improve. At the time I figured this was pointless lip-service, but I dutifully responded with reasonable requests. One of these requests was for free coffee.
I didn’t expect them to hire a barista, serving Arabica blends. Of course, I didn’t expect them to seriously consider the request at all. But after several years, respond they did, and by popular demand installed coffee machines. And for a good solid month I enjoyed free coffee–nothing great, but a drinkable instant coffee blend. Quick and effective.
This is how the work coffee comes in
Then, someone cut costs and changed the blend. Now, I can drink some pretty awful coffee, but overnight, the coffee had turned into toxic waste. And toxic waste is probably less bitter–you know, the glowing green kind? Sadly, I returned to making my own. But the years passed and the machines remained, so someone had to of been drinking it. Upon this realization, I started more closely observing who was still getting cups of the sludge. They all fell into a certain demographic: from Sales, tall, men, middle-aged. I wondered why successful businessmen were less picky about the quality of their coffee. Then, I considered my father-in-law. He is a retired defense-contractor engineer. He also drinks Folgers.
I wondered: is coffee quality preference inversely proportionate to income level? To answer this question, I decided to waste time and put off auditing the emails I needed to send out.
To quantify this correlation, I needed figures. I felt it was safe to assume that the cost of the coffee blend increases with its quality. What I needed then, were some salary figures. To graph the slope, I only needed two points. The first point was easy: take the most expensive coffee I see regularly in grocery stores: $15 a bag; and the lowest income bracket, minimum wage: $15,080. For the second point, I needed the cost of the cheapest instant coffee available (what I presumed was being used in the machines at work). Courtesy of Amazon, I found it at $3.33 a bag. Then, consulting the various online utilities designed to inform the masses that everyone’s underpaid, I found the average salary for an experienced Sales manager to be around $115,000. Now I had two points. It was time to calculate the equation.
First, I calculated the cost per ounce of each coffee. Going off a 12-ounce bag, the expensive coffee was $1.25 and the cheap coffee was $0.28. But, to make these number more manageable for a formula, I multiplied by 100 to use cents, creating nice whole numbers to work with: 125 and 28.
With standard algebra, we can calculate the slope with (Y2-Y1)/(X2-X1):
(28-125)/(115000-15080)=~-0.000970777, or if you want to follow significant figures, -0.00097.
Following Y=MX+B, we need B to be X0 (in this case, the baseline of minimum wage) to equal the $15 coffee mark. But first we divide by 100 to bring the scale back down. After doing so, B is simply calculated to be 140. Final formula:
((Slope*Salary)+140)/100
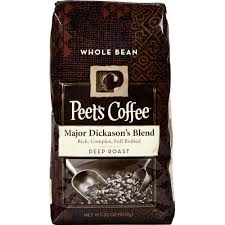
Sadly, I could not find an online calculator that provides coffee products by cost per ounce. Searching for one only yielded a number of self-righteous articles criticizing how much coffee costs and how stupid people are for buying Keurigs or going to coffee shops. But I did plug some numbers into the calculator, and my own coffee preference: Peet’s, ranks approximately by cost the type of coffee I should be buying. So once again, the math doesn’t lie:
There comes a time in every man’s life when he thinks: “Huh, this job sucks. Why am I here?” And it is indeed a very good question. Blessed not are the proletariat masses who punctually arrive at work, only to question the work they do, and by extension, the meaning of life. But rather than pass a joint and write poetry, I will continue my series on Quantitative Philosophy and instead enlist the field of mathematics to answer these questions.
Actually, I’m just going to calculate whether or not your job’s compensation is sufficient for its level of stress, and subtly suggest whether or not you should seek alternate employment. How will I do this? Why, the same way I compile data for all subjective forms of human existence: polls.
And don’t you judge me, all you MBAs out there. In my experience, employers have carefully calculated just how little they can pay for a given job, and they do this well, otherwise we wouldn’t have minimum wage laws. This is merely an extension of that philosophy, only calculated from the employee’s side instead.
We will start with a job’s variables that make it less desirable, or as I will translate: things which cause stress (Stress Factors). Through discussion, the common complaints and therefore sources of job stress are:
Superiors
Suboordinates
Customers/Clients
Coworkers
Self (Internal stress, related to self-actualization)
This albatross is experiencing job-related stress (‘BRING ME THE EPIDERMAL TISSUE DISRUPTOR!’)
Financial compensation is obviously the primary negator, but a broader perspective of that is what we do with the paycheck that negates the stress. Therefore, we start with the weekly net income, and from this figure subtract the negators (or, negators from the negator–double negatives). Again, using poll data, I have narrowed these variables to:
Weekly gross income of minimum wage (because you have to be making more than minimum wage to have disposable income, and this is a base figure for which we all weigh our financial success)
Weekly estimated cost of alcohol consumption (substitute your drug of choice)
Weekly estimated cost of luxury edibles (fine dining–a universal constant)
The assumption being made is that the minimum required amount of excess finances to achieve happiness with an average stress level of 65% at a weekly net income of $450. This sets the baseline…or at least it did. Minimum wage has gone up considerably since I made this calculator, so the explanation is no longer consistent with the math. Now it appears that for the given salary, a job caps at about 25% the maximum level of stress a job could offer. This is a pretty low level of stress. In any case, here is the formula:
(0.14(net income – (sum of negators)))/0.5(sum of stress factors +1))
And as before, the formula is scaled, this time to range from 0-5 (5 being the ideal job), with each stress factor receiving a rating of 0-10, 10 being the most stress. Inputting my own figures, I receive a 4.33. Hmmm, I’m not so certain that this has scaled well with time, or if it’s entirely linear. A job with a maximum stress level appears to only require a weekly net income of ~$585, and I would not be a stock broker for less than $60K a year. But it does appear that I’m on version 6 of this calculator as of 1/7/16, so it may be due for an update. Also, it doesn’t account for an area’s cost of living, so adjust the minimum wage accordingly.
In any case, give it a try and find out where you rank. I can tell you with certainty that if you rank below a 1, scaling issues aside, your job sucks and you need to find a new one (I told you I would give a subtle suggestion). Now stop reading this and get back to work!
In the previous article on Quantitative Philosophy, I discussed the nature of humor and how, once defined, we can quantify how funny something is. Humor is one of the most human concepts that I can think of, so adding to this theme, I will break down what it means to have a good long-term romantic relationship, mathematically. Because we as humans have a number of emotional and intellectual needs, determining a person’s viability as a mate requires that this person contribute to these needs. But what are these needs? To answer that question objectively, I polled the largest sample size of coworkers I could without being called into Human Resources. Based on the results of that poll, I have narrowed the criteria to 10 such needs:
Degree of sexual attraction to the person
Degree of importance placed on the person’s financial income
Degree of similarity of moral views with the person
Degree of similarity of political views with the person
Degree of equality regarding reciprocation
Degree of similarity of hobby interests
Number of years already spent with the person
Degree of shared importance of pets in the relationship (or perceived future importance, if no pets yet exist)
Degree of shared importance of children in the relationship (or perceived future importance, if no children yet exist)
Degree of ability to consistently maintain conversation without active effort
Naturally, I will explain each of these as some sound a little abstract. Also, based on their frequency in the poll results, they are not all of equal importance. Therefore, they have an assigned multiplier which will be explained as well:
Degree of sexual attraction to the person
This primary requirement certainly isn’t unique to humans. Rather, it is a prerequisite for a more basal need: survival of the species. A physical reaction to another person is an evolutionary response to their reproductive viability–presumably the primary reason for forming a relationship to begin with. And, while a relationship can exist without attraction, even anecdotally, I’ve never encountered a single example where it has. Certainly we could discuss alternate forms of sexuality, but for the sake of the article I’m sticking to common heterosexual relationships. Is due to this criteria’s biologic roots and ubiquity that it is assigned a 10X multiplier.
Degree of importance placed on the person’s financial income
Ah yes, the elephant in the room, yet still not as important as we are led to believe. There are studies which conclude that incremental increases beyond a reasonably comfortable standard of living do little to impact the health of a relationship. Still, money is a chronic point of stress in a relationship, and a certain minimum baseline is needed for general happiness, so it’s no surprise that for general happiness to carry over to a relationship, finances are required. It is because of this general requirement that it has been assigned an 8X multiplier.
Degree of similarity of moral views with the person
Peter Wiggin’s pal
And now we begin to touch upon the human-specific criteria. Morality in this context is social conduct. This is more obvious than it sounds. Say, for instance, if my wife began torturing animals and throwing rocks at people (well, I might laugh at the latter, depending on the victim), I would translate those senseless acts of aggression to a future prediction of her conduct towards me. It’s an extreme example, but relevant. Relationships cannot exist with moral dissonance, so it is therefore rated a 10X multiplier.
Degree of similarity of political views with the person
However, there are extreme examples
Politics serve two purposes: they are the public’s collective perception on the state’s economic direction, and an extension of morality. Inevitably, the two are at odds. Specifically, it is the attempt to resolve this conflict as a group that defines politics. Because of its moral aspect it should be rated high, but due to its volatility and infinite complexities, it’s impossible to ever share an exact political view with another person, so it is ranked a modest 7 multiplier.
Degree of equality regarding reciprocation
Obviously if a person doesn’t get anything out of a relationship, then there’s no need to be in one. There is no explanation for this category, as it’s based on the perception of feeling. But anecdotally, many a loveless relationship has been attributed to giving too much and receiving too little, or not sharing chores fairly, so based on this frequency, it is given a 9 multiplier.
Degree of similarity of hobby interests
All things considered, you need something to do with your mate for recreation (besides that implied in the first category). But, with so little time available in established relationships to spend on shared interests, there doesn’t need to be many, and often the simple and common pastimes suffice. It is therefore rated a 3X multiplier.
Number of years already spent with the person
This category serves two purposes: First, we have what is called the “emotional investment” factor. While many argue that this causes loveless marriages to persist, in a broader sense it simply places value on time. As mortals, time is the enemy. Second, while you may not agree with the first point, there is a demonstrable correlation between newer couples rating their partners higher than older ones, simply out of infatuation. This category accounts for bias, and it is assigned a 10X multiplier.
Degree of shared importance of pets in the relationship (or perceived future importance, if no pets yet exist)
This one was surprisingly common. People as a whole are very concerned with pets. Draw your own conclusions, but since it’s only on this list due to its frequency in the poll, yet cannot be correlated to the success of a relationship, I ultimately settled on giving it a 3X multiplier.
Degree of shared importance of children in the relationship (or perceived future importance, if no children yet exist)
Children, on the other hand, can and will make or break a relationship. This should require no explanation. If the couple doesn’t agree on the status of children, there is a high probability of that relationship failing. Chalk this one up to evolution and directly related to sexual attraction. It is given a 10X multiplier.
Degree of ability to consistently maintain conversation without active effort
This one was difficult to define, being more a feeling of emotional contentment. So to assign it an empirical value, I’ve correlated it to the ease of intra-couple communication. If talking comes easy, it demonstrates a lack of tension between the individuals, which means they have a bond. I’ve also found that the age of the relationship has no impact on this category. A couple either has a connection or they don’t. And since this state of mind is vital to emotional health, it is a 10X multiplier.
How the formula works
To simplify the equation, I will replace the numerical categories 1-10 with alphabetic variables, respectively A-J.
Assign a value to each of the categories of 0-10, with 10 being the highest. The only exception is the number of years together, which is the actual number. Still, this category caps at 10, as the benefits of investment reach a point of diminishing returns (anecdotally, from the poll).
The math is scaled for a simple 0-100 range, with sub-ranges representing various levels of compatability. The formula is as follows:
[1.25(10A+8B+10C+7D+9E+3F+10G+3H+10I+10J)]/10
As before, here is a link to to download the calculator yourself:
In practice, I have been told that the results of this calculator were uncannily accurate, which makes me nervous. Perhaps it’s a number, like your IQ, that does you no good to know.
But before you ask, I will say that I will wisely not be providing an analysis of my own marriage as an example, although so as not to be hypocritical, I will say that the calculator is still in favor of me staying with my wife, so whew. Good luck, and probably don’t show the results to your spouse; or do, if you want to stir things up at home, or have evidence of irreconcilable differences for your divorce lawyer.
If you tuned in for my post on Quantitative Philosophy, you may recall my promise to provide mathematical models for segments of the human experience. This is indeed once such model. If you’re here looking for another post on how I find the business world’s systems of reinforcement incongruous with the results they ultimately condition, this is not that post. Although, perhaps later I’ll dive into how the merit raises work.
But nay, I shall start with a model based on the most human of characteristics–one which requires the highest of brain function–humor. Indeed, I found the concept difficult to describe, as its existence relies upon the prerequisites of feeling and emotion–two other concepts difficult to comprehend, though simple to attribute to species survival. Quite simply, humor is but an extension upon these concepts, so we can begin there.
Emotions are, in their most primal form, reactions to stimuli, which influence actions geared to keep us alive. Survival requirements, and their respective order of requisition, were famously defined in Maslow’s Hierarchy of Needs:
Air/Water/Food (physiological needs)
Physical safety
Social belonging/love
Self-esteem
Self actualization/Purpose
With the heightened awareness that sentience allows, humanity needed a coping mechanism for when one of these needs is threatened, so as to keep the brain from experiencing a stress-related shutdown. Enter: humor–a positive emotional reaction of levity as a reaction to understanding a perceived threat to one of these needs. I say perceived, because once a need is actually threatened, we need a stress reaction to manage the crisis quickly–something that is demonstrably not a positive feel-good reaction.
How do I know this? For one, I am human (though others may debate this claim). And two, because the substance of a joke invariably falls into two criteria: Social Commentary and Historical Reference. These two concepts, by definition, invoke failures of humanity, not triumphs. Granted, a joke may contain widely variable substance in these categories.
Let’s analyze a joke for context:
‘Why did the chicken cross the road?’
‘Why?’
‘To get to the other side.’
The joke, most simple in form evokes feeling. The recipient of the joke wonders about that chicken. The chicken has an objective. The chicken has become anthropomorphized. We feel for that chicken. We want to know about that chicken and why it felt the need to cross that road. This is social commentary.
Also, it contains historical reference. We need to understand what a road is–an invention of humanity based on the need to service other inventions. And, historically, we all know that animals crossing roads may be perilous to their health.
And that, is the threat necessary for the humor trigger: the chicken is having one of its needs jeopardized. Its physical safety is in danger.
Say whaaat?
Alas, no harm befalls this chicken. We never learn why it felt compelled to cross the road, nor do we learn of its fate. We laugh over these unresolved questions, while understanding that the hook of the story relied upon that chicken’s mortality, and by extension, our own.
But this alone does not make the joke. It is merely a story. To become a joke, it requires two other aspects: Delivery, and Satirical Value. We wait, momentarily on edge, eagerly seeking the story’s climax. So the wording of the joke affects it’s delivery. It’s phrased in a question to invoke the listener’s interest and encourages his/her reaction. Secondly, the conclusion of the joke is mere satire, or in this case specifically, irony. It’s ironic that the story’s conclusion has nothing to do with the actions of the perceived feelings of the chicken. It simply wanted to get from point A to point B–something completely uninteresting. We are left without any compelling narrative, despite the initial impression of one, and that’s ironic.
Formula
To quantify humor then, we take the base substance of a joke, the Social Commentary and Historical Reference, and add them. We take this combined substance, and append the joke’s Delivery and Satirical Value as multipliers:
In this manner, we find jokes can have varying degrees of each category, but the funniest jokes always find ways to maximize each. Additionally, no criteria can be rated to have a null value, as any joke will always contain even the smallest quantity of each, and each criteria can receive a maximum score of 10. The total score ranges from 1-100 (technically 0.1-100), so we scale for the theoretical maximum by dividing by 20. For the above referenced joke, I have rated it a 10:
(5*8(3+2))/20
Granted these are arbitrary scores, but I find that gut reactions in this instance are the most accurate, seeing as, after all, we are attempting to quantify an emotional response. I’ve included a link to download the calculator, which further explains how to score a joke as well as automatically completing the math:


 Sadly, I could not find an online calculator that provides coffee products by cost per ounce. Searching for one only yielded a number of self-righteous articles criticizing how much coffee costs and how stupid people are for buying Keurigs or going to coffee shops. But I did plug some numbers into the calculator, and my own coffee preference: Peet’s, ranks approximately by cost the type of coffee I should be buying. So once again, the math doesn’t lie:


 The joke, most simple in form evokes feeling. The recipient of the joke wonders about that chicken. The chicken has an objective. The chicken has become anthropomorphized. We feel for that chicken. We want to know about that chicken and why it felt the need to cross that road. This is social commentary.